Working with Intensity Ranges
The options in the Range box on the ROI Tools panel allow you to define an intensity domain of image data values and then use the selected range to create a new region of interest. You can also add or remove the range from a selected ROI. Intensity domains are also applicable to other tools, such as the ROI Painter tools, morphological operators, and clipping tools. In this context, any voxel that corresponds to a value outside the range will not be selectable or affected by any applied operation.
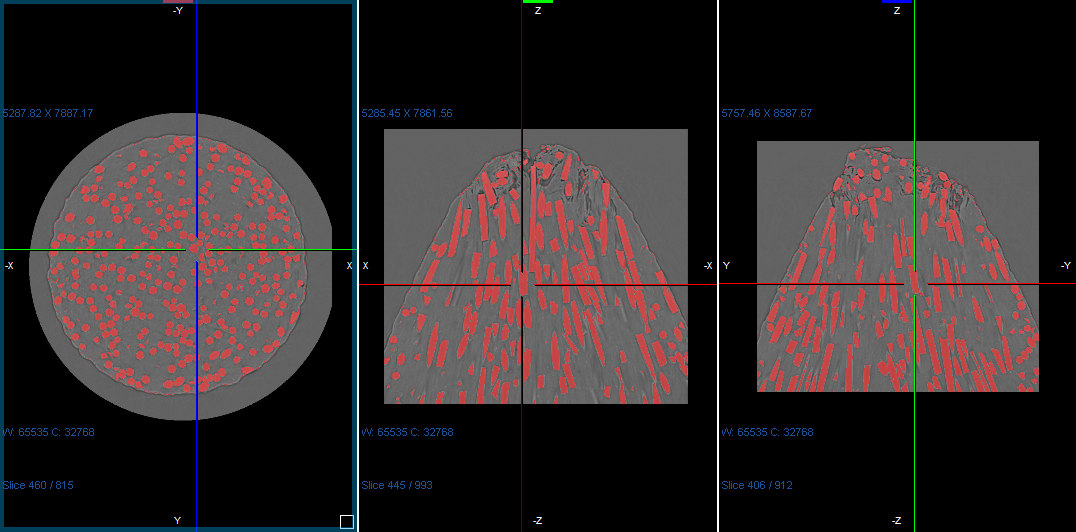
An intensity range selected for the fibers within a dataset is shown below. Intensity ranges are highlighted in red by default. However, you should note that another highlight color can be selected in the Colors preferences (see Selecting the Colors Preferences).
Selected range example
Creating a region of interest within a range of data can provide a good first step in the segmentation process. You can edit the results with the ROI Painter tools, morphological operators, or you can use the Object Analysis tool to separate objects within the region of interest (see Using the ROI Painter Tools, Applying Morphological Operations, and Quantification).
Range tools
| Description | |
|---|---|
|
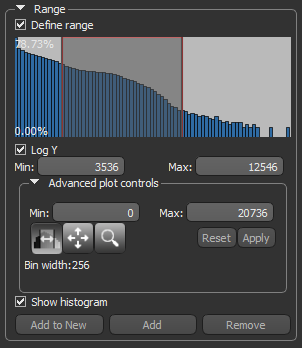
Define range |
Applies a domain of intensity on 2D views of the selected image data, which is highlighted a constant red. |
|
Histogram |
The histogram at the top of the panel shows how values are distributed within the select image data. The darkest parts will appear on the left side of the graph, the midtones will appear in the middle, and the brightest parts (highlights) on the right side. If required, you can select the Log Y option to plot the Y-axis in log scale. NOTE The Y-axis percentages are calculated as the total number of voxels of the largest bin plotted on the histogram versus the total of voxels in all bins. You should note that number of bins is padded on the left and right side of the histogram. |
|
Threshold values |
The two numbers under the histogram are the minimum and maximum threshold values. These two values define the display range, or window. |
|
Advanced plot controls |
Provide additional options for defining intensity ranges (see Advanced Plot Controls) for information about the using the advanced plot controls. |
|
Show histogram |
Toggles the visibility of the histogram. |
|
Add to New |
Creates a new region of interest in which all voxels within the selected range will be labeled. |
|
Add |
Adds voxels within the selected range to the current region of interest. |
|
Remove |
Removes voxels within the selected range from the current region of interest. |
- Select the image data from which you plan to define the intensity range in the Data Properties and Settings panel.
You should note that if you are working with fused multi-modality images, you can alternate between datasets when you add ranges to a region of interest.
- Select the Define range option in the Range box on the ROI Tools panel.
The full range of data in the selected dataset in included in the range by default.
- Check the Show histogram option to plot a histogram of the intensity values, recommended.
You can scale the Y-axis is log scale, if required.
- Define the intensity range that best describes the feature or features you need to segment.
- Drag the left or right Range sliders to change the minimum or maximum values of the intensity range (window width).
- Drag from the middle of the Range slider to translate the intensity range values (window center).
- Enter the required values in the Lower and Upper Limit edit boxes.
- Verify the selected range on other images within the image stack, recommended.
- Do any of the following, if required:
- Click the Add to New button to create a new region of interest. All voxels within the specified range will be labeled in the new region of interest.
Information about the new region of interest is displayed in the lower section of the Data Properties and Settings panel (see ROI Properties and Settings).
- Select a region of interest in the Data Properties and Settings panel and then click the Add button. Voxels within the selected range will be labeled in the selected region of interest.
- Select a region of interest in the Data Properties and Settings panel and then click the Remove button. Labeled voxels within the selected range will be unlabeled in the selected region of interest.
- Click the Add to New button to create a new region of interest. All voxels within the specified range will be labeled in the new region of interest.